Introduction
What is Lookout and how does it work?
Lookout is a small, self-hosted monitoring agent for Linux servers. It runs as a systemd service on the machine you care about, watches the basics, and sends an alert when something crosses a threshold or stops reporting — no SaaS, no cloud dependency, no per-seat pricing.
One static binary, one YAML file, one systemd service. It's built for the kind of server where you want useful alerts without running a full Prometheus stack.
What it watches
Lookout collects metrics from the local machine and evaluates alerts in-process.
| Area | What Lookout checks |
|---|---|
| Memory | Used memory %, from /proc/meminfo and MemAvailable |
| Swap | Used swap % |
| Disk | Used % for each configured mount |
| Disk growth | Whether a disk is on pace to fill within a window |
| Load | 1-minute load average ÷ CPU cores |
| CPU | CPU usage %, from /proc/stat |
| systemd | Whether named services are active |
| HTTP | Whether configured URLs return the expected status code |
| TCP | Whether configured TCP addresses accept a connection |
| Processes | Whether named processes are running |
| Docker | Container exits, OOM kills, restart loops, failed healthchecks (optional) |
| Heartbeat | An outbound dead-man's-switch ping (optional) |
Memory, disk, CPU, swap, and load run out of the box; the service, HTTP, TCP, and process checks start working once you list what to watch.
How it works
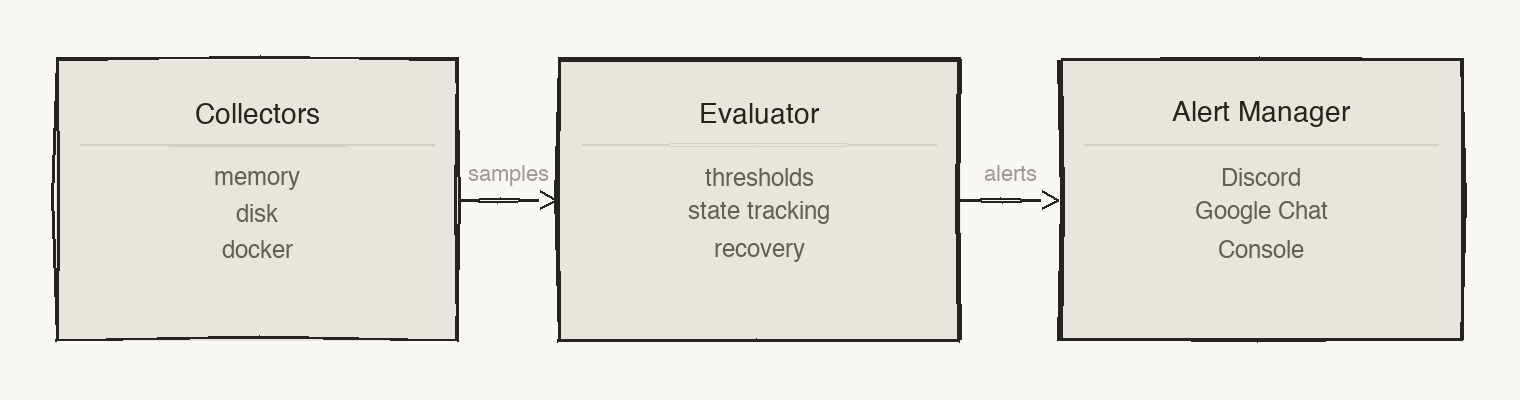
Collectors read from the kernel (/proc/meminfo, /proc/stat, /proc/loadavg, /proc/mounts), the Docker daemon, systemd, and the network, and normalise everything into typed metric samples.
The evaluator checks each sample against your configured thresholds. It is stateful: it waits for a value to stay over the line before alerting, won't re-notify until a quiet period passes, and sends a recovery message when the value drops back down.
Notifiers dispatch alerts to every channel you enable — Google Chat, Discord, Slack, Microsoft Teams, Telegram, PagerDuty, a generic webhook, or email. With nothing configured, alerts print to stdout and land in the systemd journal.
Alert state is stored at /var/lib/lookout/state.json, so Lookout remembers what's firing across restarts and sends clean recoveries instead of starting from scratch every time.
If you already run Prometheus or Grafana, Lookout can optionally expose its readings at GET /metrics — see Prometheus metrics.
Beyond local metrics
If the whole machine goes offline, the agent can't alert you. Lookout's heartbeat sends a regular ping to a dead-man's switch — and Lookout's hosted heartbeat monitoring can be that switch, so you don't have to bring a third-party service.