Alerts
How Lookout evaluates metrics, fires alerts, and sends recoveries.
How alerting works
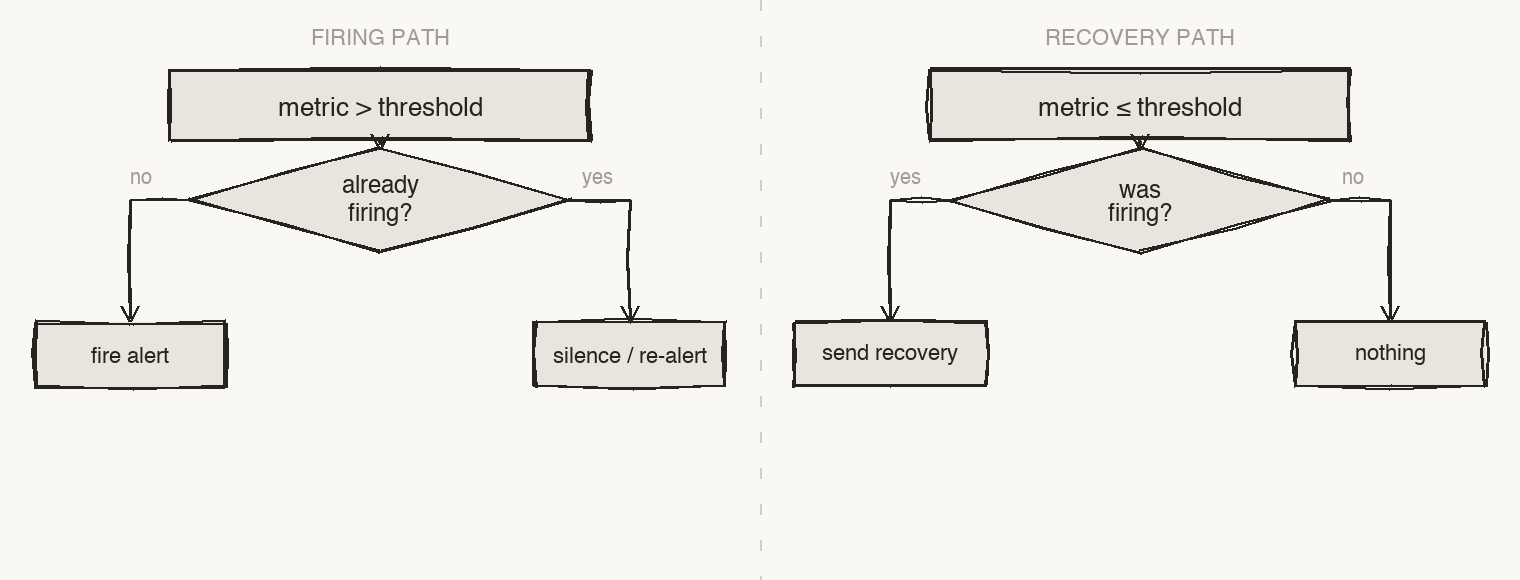
Every collection cycle produces a set of metric samples. The evaluator checks each sample against the rules in your alerts config and tracks each rule's state over time, so it knows whether an alert is already firing.
There are two kinds of rule:
- Threshold checks —
memory,disk,cpu,swap,load. They compare a number against athreshold, clear atresolve_below, and only fire once the value has stayed over the line forfor. - Service & presence checks —
systemd,http,tcp,process. They fire when something isn't healthy (a service is inactive, a URL returns the wrong status, a port won't connect, a process is missing) and clear when it recovers.
Alert lifecycle
- You are notified once when a problem starts — after it has persisted for
for. - If it is still firing after
renotify_after, you get a reminder. - A recovery is sent when it clears, so you always know when things are back to normal.
- If a metric stops reporting for
stale_after, Lookout flags it as stale (default: three times the collection interval).
State is persisted to /var/lib/lookout/state.json, so a service restart doesn't replay old alerts or lose track of what's firing.
Severity
Each check has a severity of warning or critical. It sets the label, emoji, and color of the alert (and maps to the PagerDuty severity).
| State | Label | Color |
|---|---|---|
| Firing, warning | 🟡 WARNING | amber |
| Firing, critical | 🔴 CRITICAL | red |
| Resolved | ✅ RESOLVED | green |
Threshold checks default to warning; service, presence, and Docker checks default to critical.
Built-in threshold rules
| Rule | Metric | Default threshold | Message |
|---|---|---|---|
| Memory | memory.used_percent | 85% | High memory usage |
| Disk | disk.<mount>.used_percent | 85% | High disk usage |
| Disk growth | disk.<mount>.fills_within_window | within 4h | Disk predicted to fill soon |
| CPU | cpu.used_percent | 85% | High CPU usage |
| Swap | swap.used_percent | 80% | High swap usage |
| Load | load.1_per_core | 1.5 | High 1-minute load per core |
Message format
Every notification — regardless of channel — renders from the same fields:
🔴 CRITICAL — High memory usage
Host: my-server
Metric: memory.used_percent
Value: 91.43% (threshold 85.00%)
When the value drops back below resolve_below, Lookout sends the recovery:
✅ RESOLVED — High memory usage
Host: my-server
Metric: memory.used_percent
Value: 74.21% (threshold 85.00%)
Tuning
Adjust thresholds and timing in /etc/lookout/config.yaml, then restart:
alerts:
  renotify_after: 30m   # re-alert every 30 minutes while still firing
  memory:
    threshold: 80       # alert at 80% memory
    resolve_below: 75
    for: 0s             # alert immediately instead of waiting
sudo systemctl restart lookout
See Configuration for every field.